Measurelog: put the work next to the revenue chart
An analytics concept connecting campaigns and releases with a SaaS revenue timeline.
A revenue chart shows a change. It does not necessarily remind you what was happening in the business at the time.
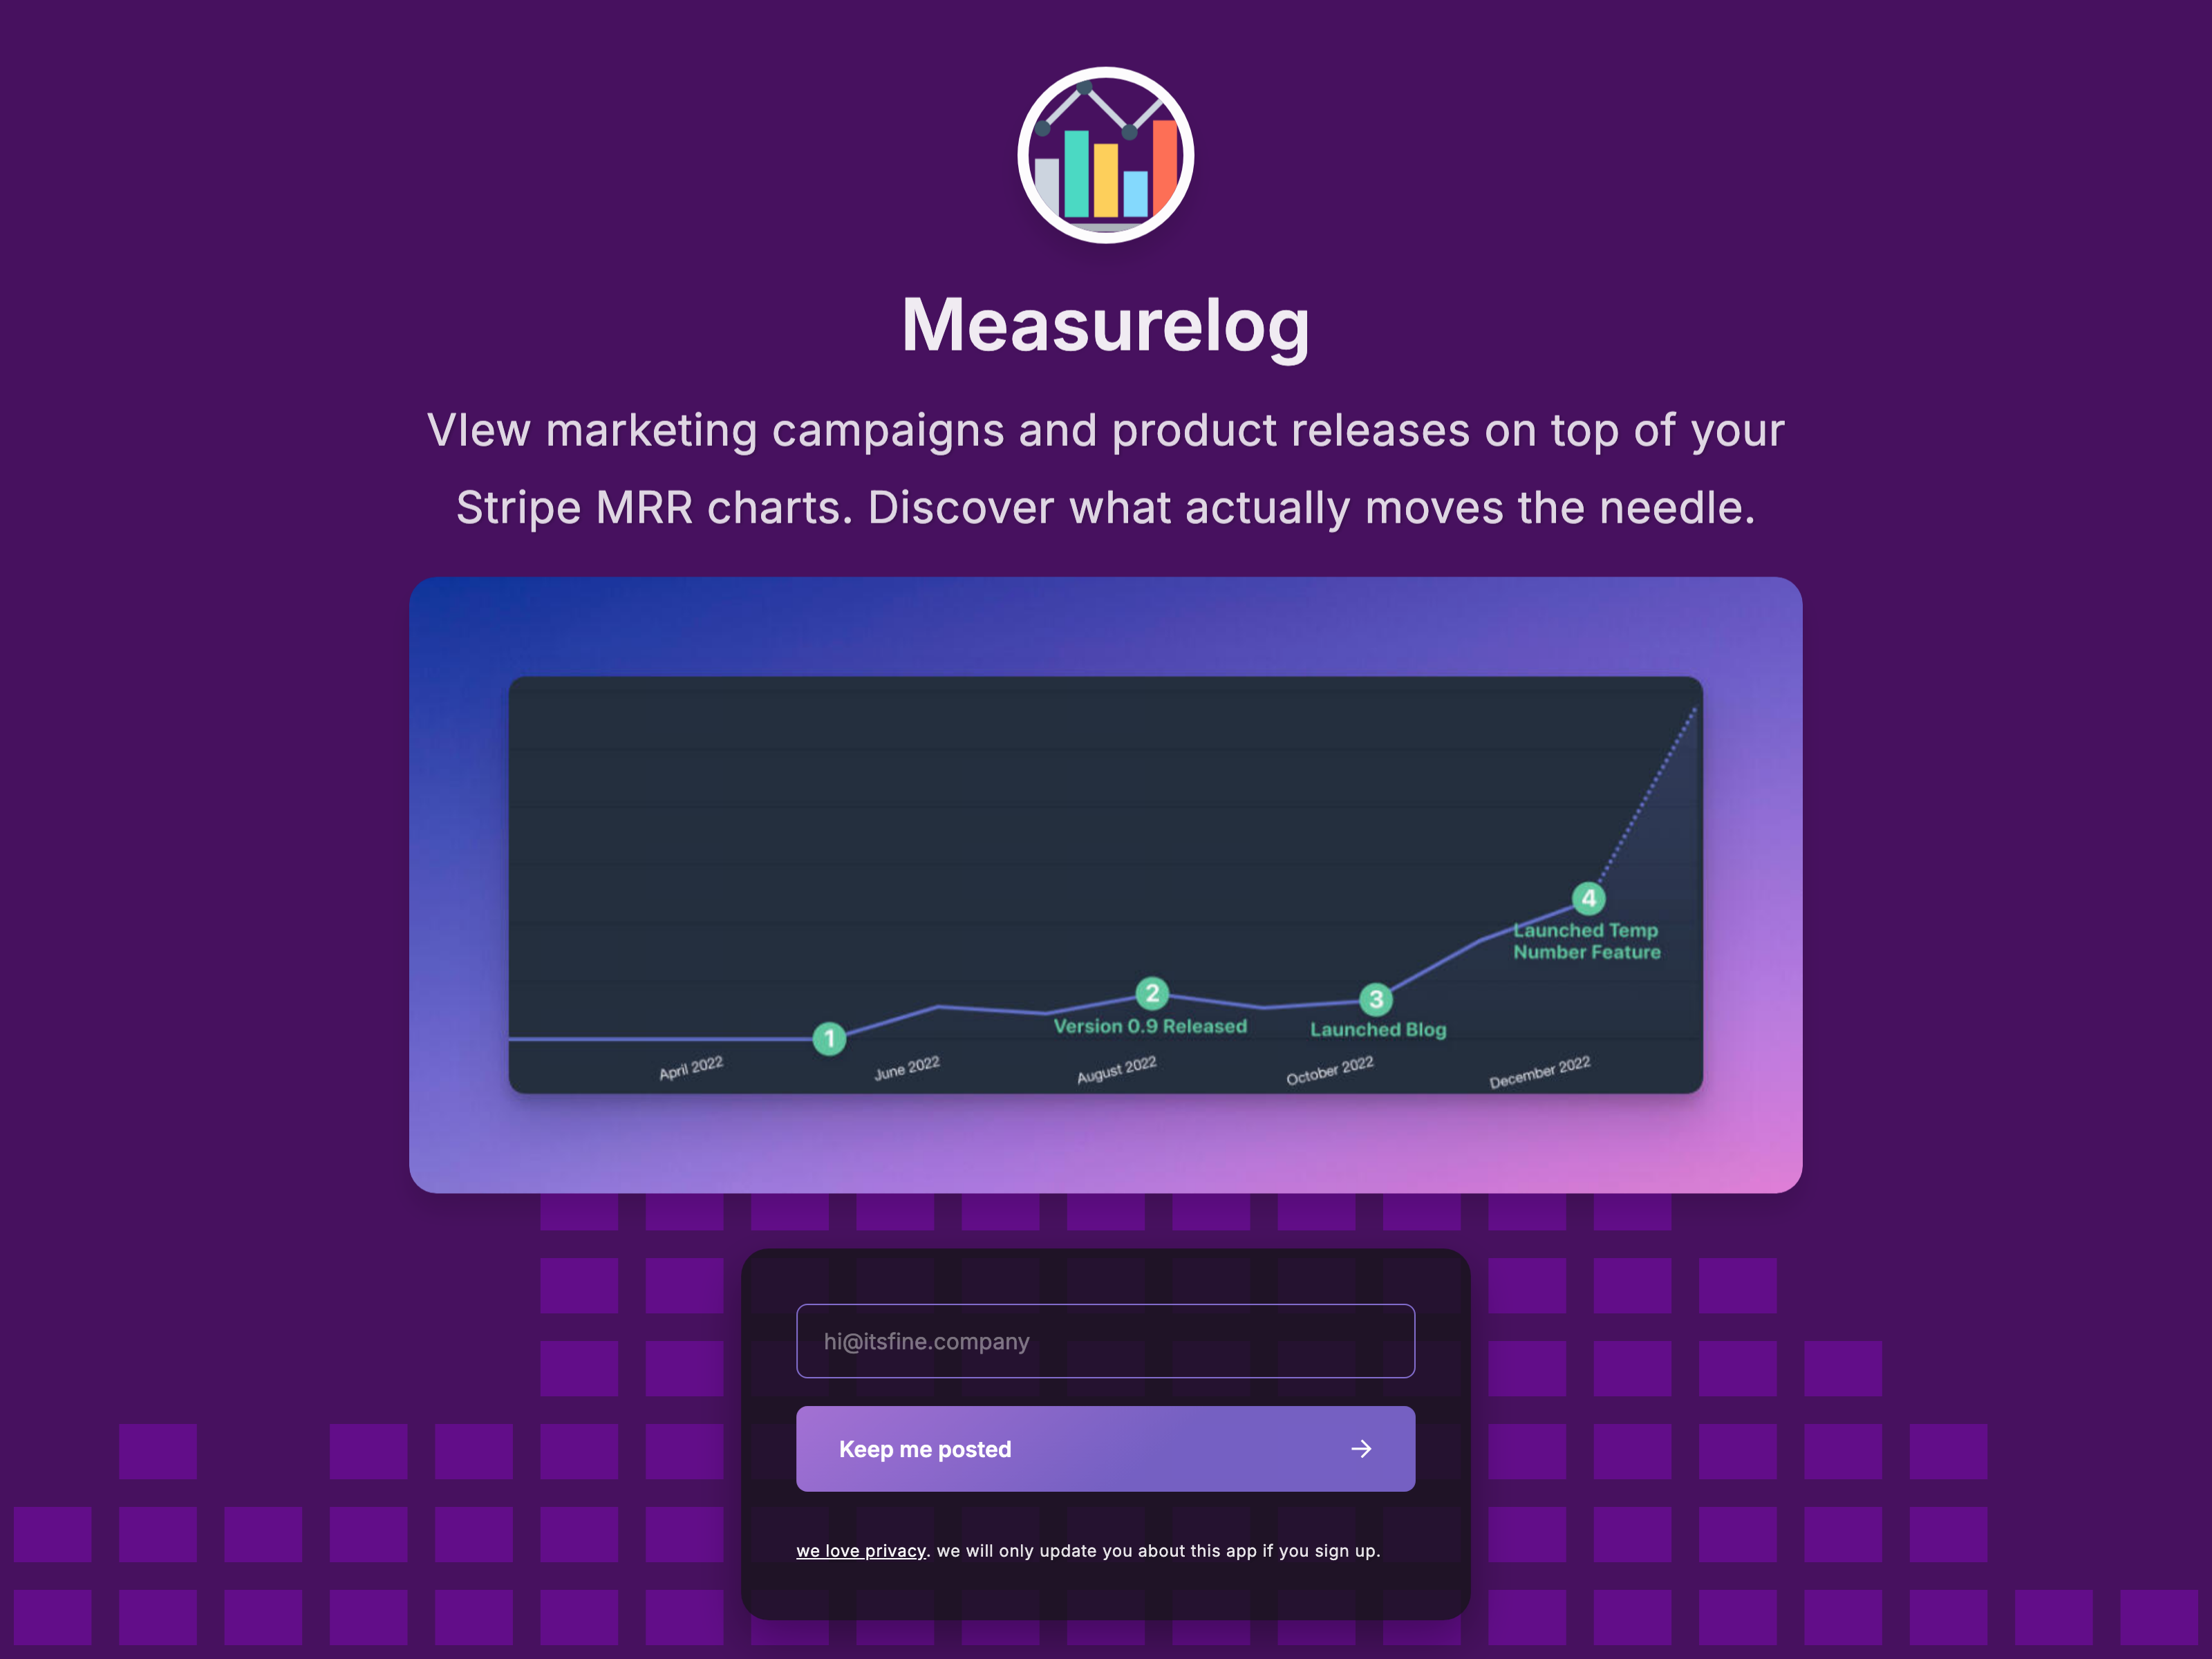
Measurelog describes putting marketing campaigns and product releases alongside Stripe monthly recurring revenue charts. The public page presents that idea and offers an updates signup.
Give the chart a memory.
Move an event along an example revenue timeline. Correlation is not causation.
Keep the context on the timeline
The useful angle is the relationship between activity and the chart. A campaign date or a release can give someone a starting point for investigating a change.
That still calls for judgment. Seeing two things close together is a prompt to ask questions, rather than enough evidence to say one caused the other.
The It's Fine website lists Measurelog under labs. For this note, the actual milestone matters: introducing the idea publicly is different from shipping a working analytics integration.
The idea gives the chart a memory of the work around it. That context is a starting point for understanding a change, with room for other explanations and further investigation.